Chapter 4 Results
Figure.2 Double Click to Display Each Air Carrier
4.1 On-time, Delay, and Cancellation
From Figure 2, we observe a clear weekly pattern for the number of flights for each carrier. For example, the number of Southwest Airlines (WN) is stable from Sunday to Friday, but it has significantly fewer flights on Saturdays. Most carriers have relatively fewer flights on Saturdays, though there are some exceptions: Allegiant Air (G4) and Mesa Airlines(YV) have fewer flights on Tuesdays. This pattern follows our experience that the schedules of flights are determined by the day of the week during one flight season - if there is a flight today, it is very possible that there will be a flight at the same time 7 days later. The number of flights of Southwest Airlines (WN) is stable possibly because it is one of the largest airlines, and it has major routine flights nearly every day.
Figure.2 Double Click to Display Each Air Carrier
For this figure (along with table “table_airline”), we can compare the delay and on-time percentage across 17 major carriers. We notice that Southwest Airlines (WN) has the most flights, and it also has the highest delayed rate, though its cancellation rate is not very high related to other air carriers.
Figure 3. Stacked Bar Chart for On-time Percentage by Carriers
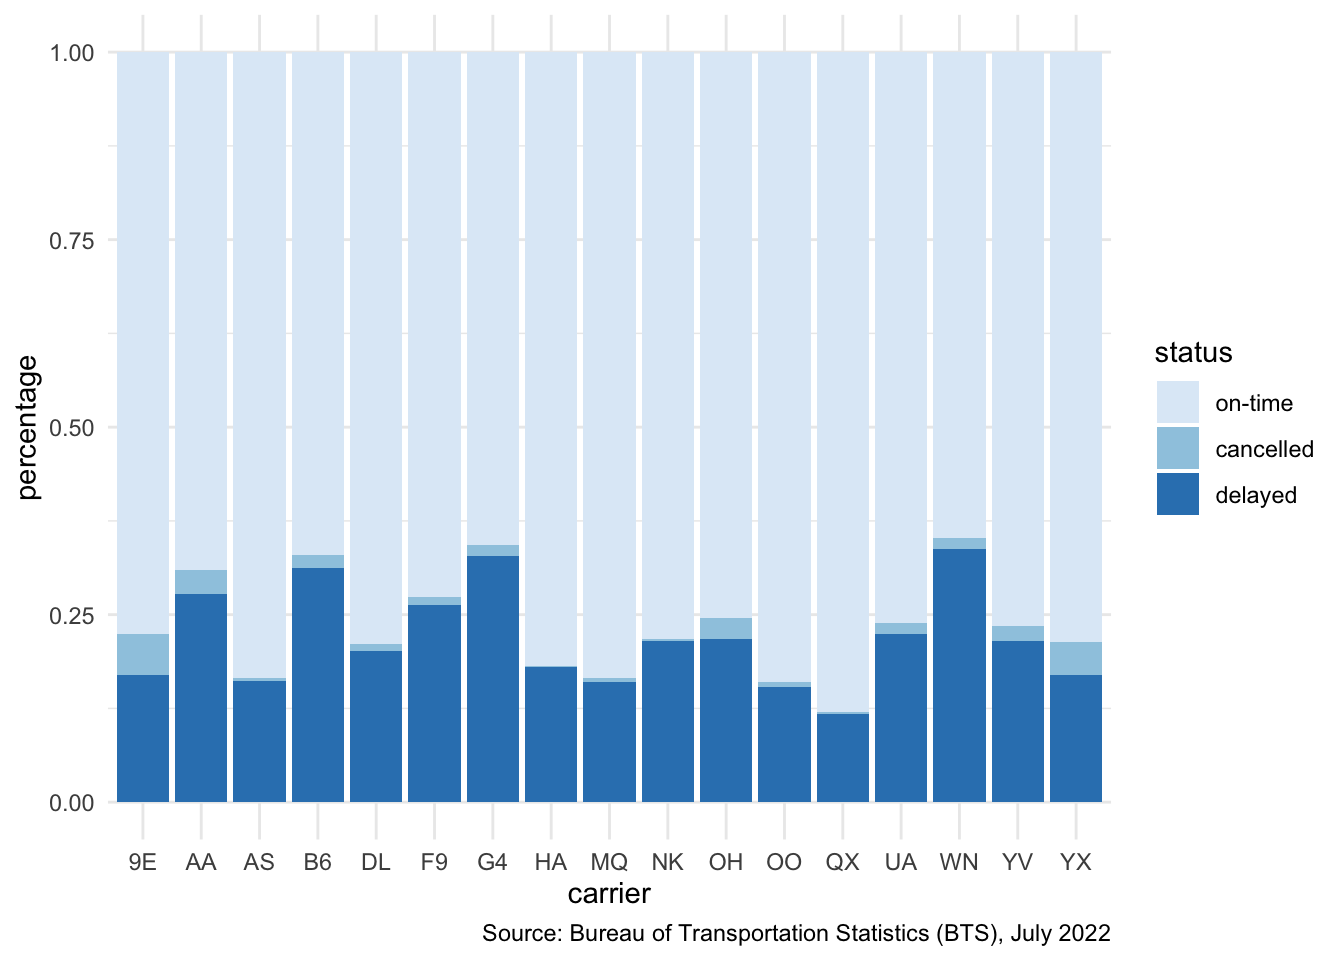
This figure below help to identify and compare the difference between 17 major airlines with quantified visualization. Large carriers (with total flights more than 50,000: American Airlines (AA), Delta Airlines (DL), Sky West Airlines (OO), Southwest Airlines (WN), and United Airlines (UA)) all have delayed rates higher than 20%; While among small carriers, Horizon Air (QX) achieves the highest on-time rate. More surprisingly, we find that while there exists a strong association between total number of scheduled flight and on-time performance, some air carrier at the same amount of flight actually out-perform than others. For example, AA and DL have similar amount of total flight, but delay rate for AA is more than 7% worse than DL. Also, some small air carriers such as AS, HA, QX, YX have lower delay rate. Therefore, total number of flight and airlines are factors to on-time performance but their contribution to flight delay various a lot, which may due to other important factors such as management within each airline and flying region of the flights
Figure 4. Table for On-time Percentage by Carriers
| carrier | on-time | cancelled | delayed | total |
|---|---|---|---|---|
| Alaska Airlines (AS) | 83.49 | 0.42 | 16.09 | 20387 |
| Allegiant Air (G4) | 65.75 | 1.48 | 32.77 | 12433 |
| American Airlines (AA) | 69.03 | 3.16 | 27.81 | 76614 |
| Comair (OH) | 75.43 | 2.76 | 21.81 | 19152 |
| Delta Airlines (DL) | 78.85 | 0.98 | 20.17 | 78767 |
| Endeavor Air (9E) | 77.54 | 5.50 | 16.95 | 20166 |
| Envoy Air (MQ) | 83.39 | 0.58 | 16.04 | 21855 |
| Frontier Airlines (F9) | 72.68 | 1.07 | 26.25 | 13175 |
| Hawaiian Airlines (HA) | 81.85 | 0.07 | 18.08 | 6754 |
| Horizon Air (QX) | 87.94 | 0.35 | 11.71 | 8516 |
| JetBlue Airways (B6) | 66.99 | 1.80 | 31.21 | 22867 |
| Mesa Airlines (YV) | 76.50 | 2.08 | 21.43 | 9590 |
| Repblic Airways (YX) | 78.63 | 4.44 | 16.93 | 26710 |
| Sky West Airlines (OO) | 83.92 | 0.77 | 15.31 | 65225 |
| Southwest Airlines (WN) | 64.73 | 1.56 | 33.71 | 117844 |
| Spirit Airlines (NK) | 78.21 | 0.34 | 21.46 | 19392 |
| United Airlines (UA) | 76.18 | 1.46 | 22.36 | 55510 |
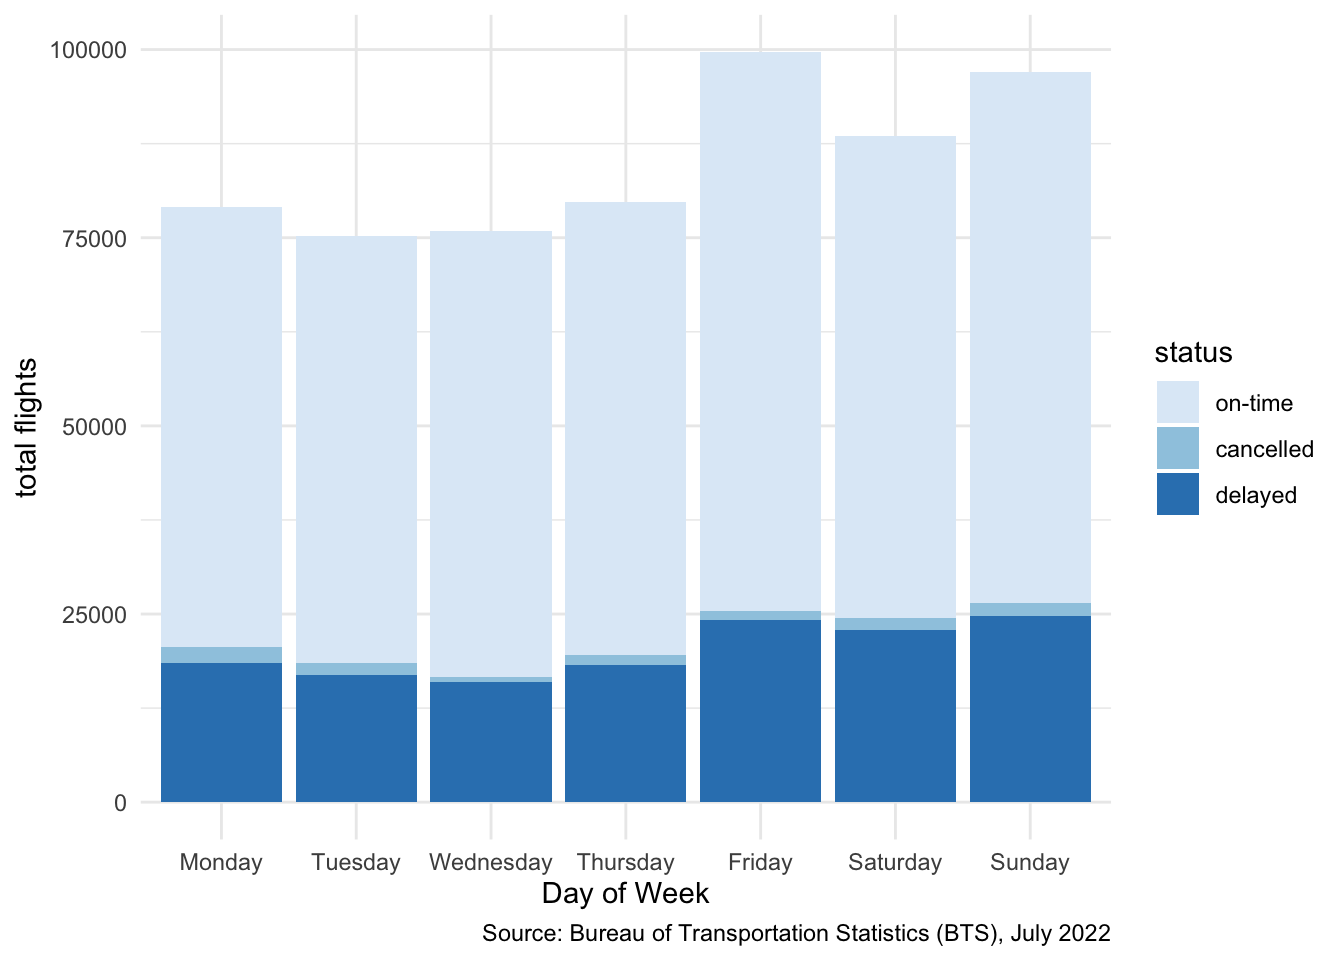
The total flights from Monday to Thursday are closed, and Fridays have the most flights, followed by Sundays which have the second highest number of flights.
Figure 5. Stacked Bar Chart for On-time Percentage by Day of the Week
4.2 Delay Analysis
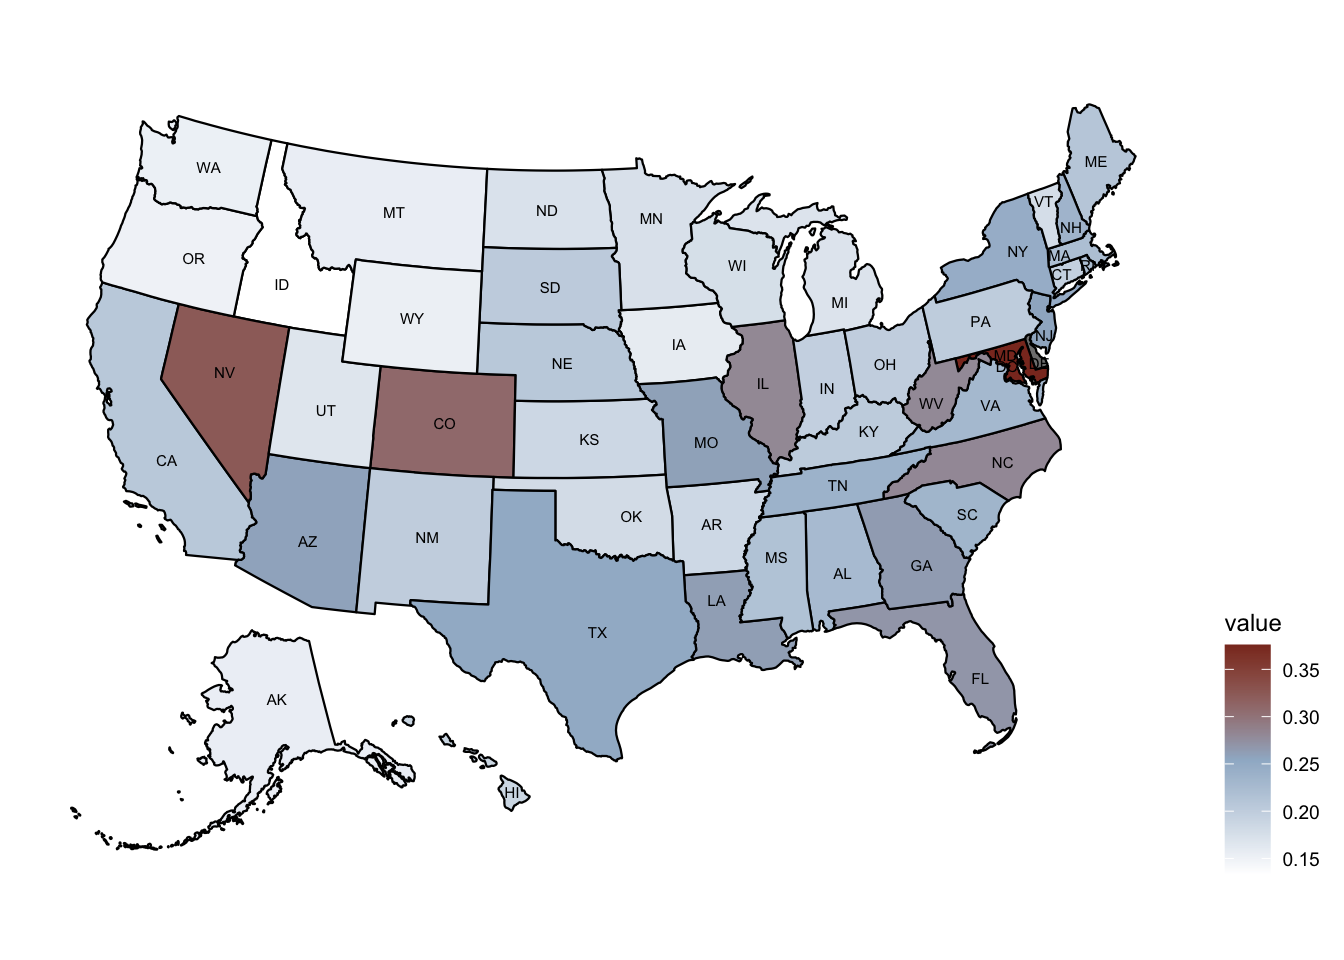
From the heat map, we notice that: Southern and Eastern States have higher delay rates, which is probably because of the higher population with busier airports. Maryland (MD) has the highest delay rate, followed by Nevada (NV) and Colorado (CO). Nevada (NV) has a higher delay rate probably because most flights in the State use McCarran International Airport in Las Vegas, which makes the airport super busy and can cause more delays. Maryland has a high delay rate probably because it has Baltimore/Washington International Airport (BWI), which is the base for Southwest Airlines (remember Southwest Airlines has the highest delay rate among all carriers)
Figure 6. Heat Map for Delay Rate of each State
The figure below visually compared the statistics for all five delay reasons (carrier, late aircraft, national air system, security, and weather). The mean of delay time in minutes are higher than those medians for all delay reasons, which implies a highly right-skewed distribution. For “carrier”, it has the highest max value and highest standard deviation. If a flight is delayed due to carrier-related reasons, it is harder to predict the delay time due to its larger standard deviation. Cause “weather” has the highest mean and median, which suggests that it is the severest reason for delays in July, which agrees with our hypothesis that the weather in the summer can influence the flights a lot. Cause “security” has a closer mean and median, with a relatively small standard deviation (also with the smallest max value). This suggests that if a flight is delayed due to security reasons, the delay time is highly predictable and it has the best worst-case scenario.
Figure 7. Table for Statistics Summary of Five Delay Reasons
| delay.cause | Min | Median | Mean | Max | Std |
|---|---|---|---|---|---|
| carrier | 1 | 22 | 47.33 | 2556 | 95.78 |
| late aircraft | 1 | 33 | 54.24 | 2096 | 69.62 |
| national air system | 1 | 11 | 25.55 | 1740 | 47.75 |
| security | 1 | 19 | 34.34 | 1132 | 68.80 |
| weather | 1 | 38 | 60.70 | 1478 | 84.92 |
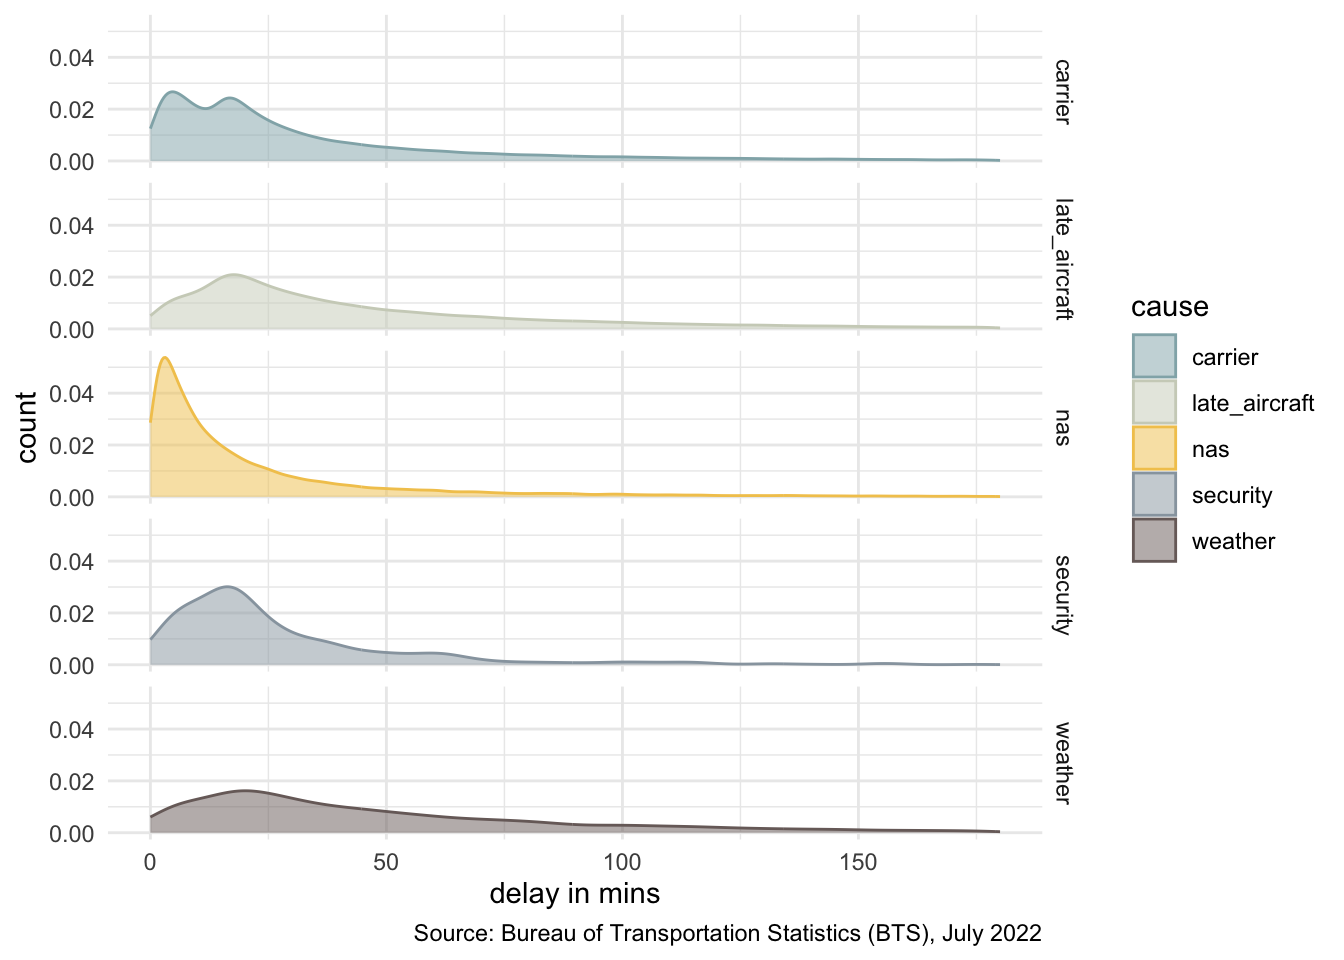
The density graph and boxplot below give us a brief idea about the distribution of delay time caused by air carrier, late aircraft, national air system, security, and weather. The order of these five reasons from highest median delay time to lowest delay time are undesirable weather, late aircraft, air carrier delay, security delay, and national air system delay. Both graphs tell that national air system delay time is averagely shorter than the other causes, while the delay caused by weather has the longest delay time among the five main causes.
The reason might be that the national air system is a relatively stable system that controlled by a reliable national organization, while weather is a relatively unpredictable factor that human cannot control. Security reason has the smallest range, and the other four reasons have about the same range. The reason might be that security delay is usually within the control of the security and regulation department, but late aircraft, air carrier delay, and national air system delay are usually caused by technical issues and airport arrangement issues that are more likely to take extremely long time to fix, and weather conditions are volatile enough to cause a large range of delay time.
Figure 8. Box plot for Delay Time by Different Delay Reasons
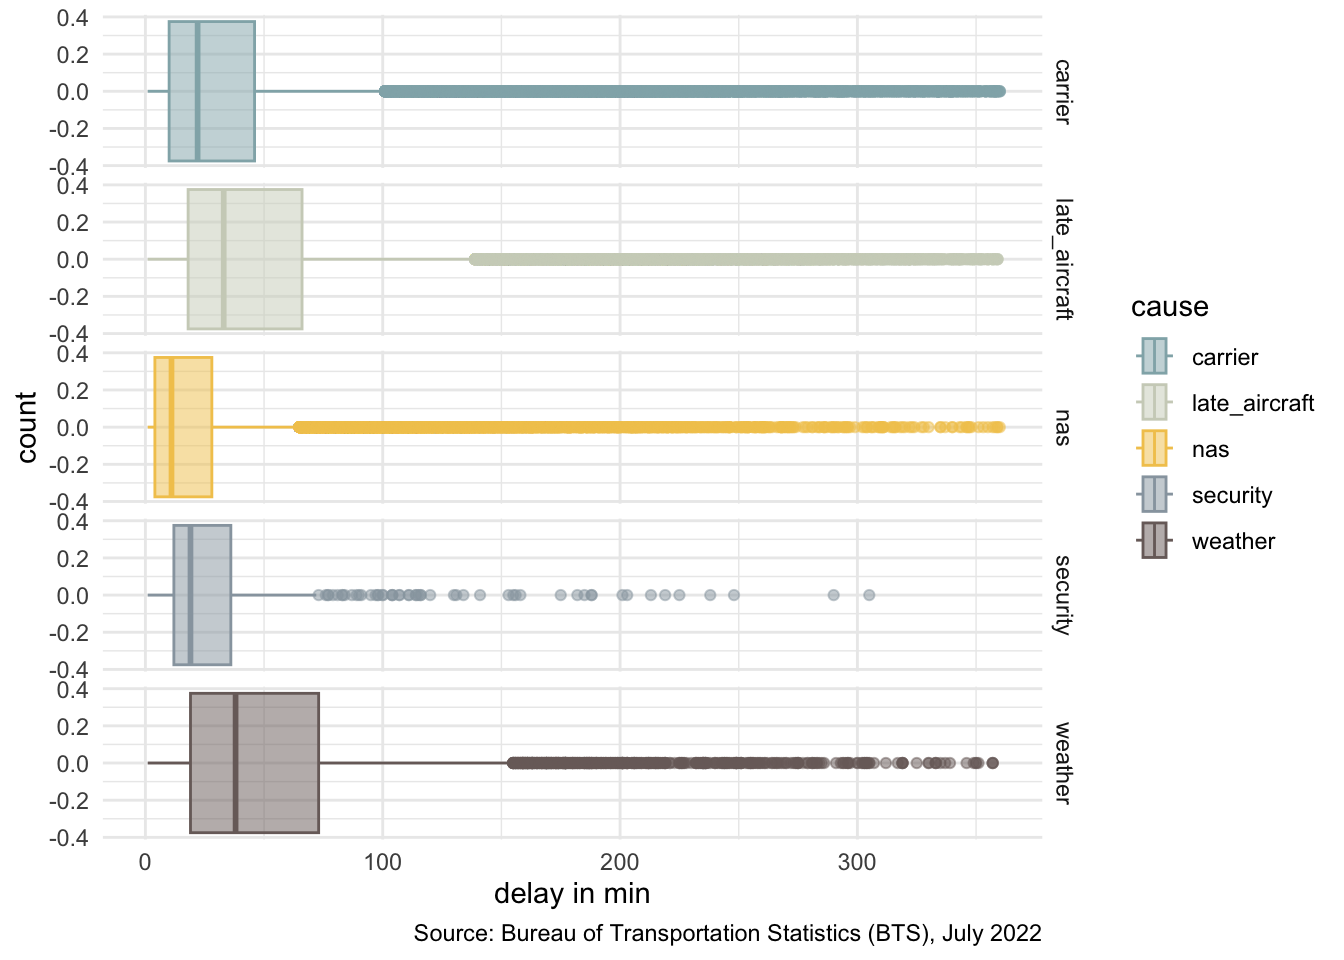
Figure 9. Density Graph for Delay Time by Different Delay Reasons
4.3 Multinomial Logistics Model
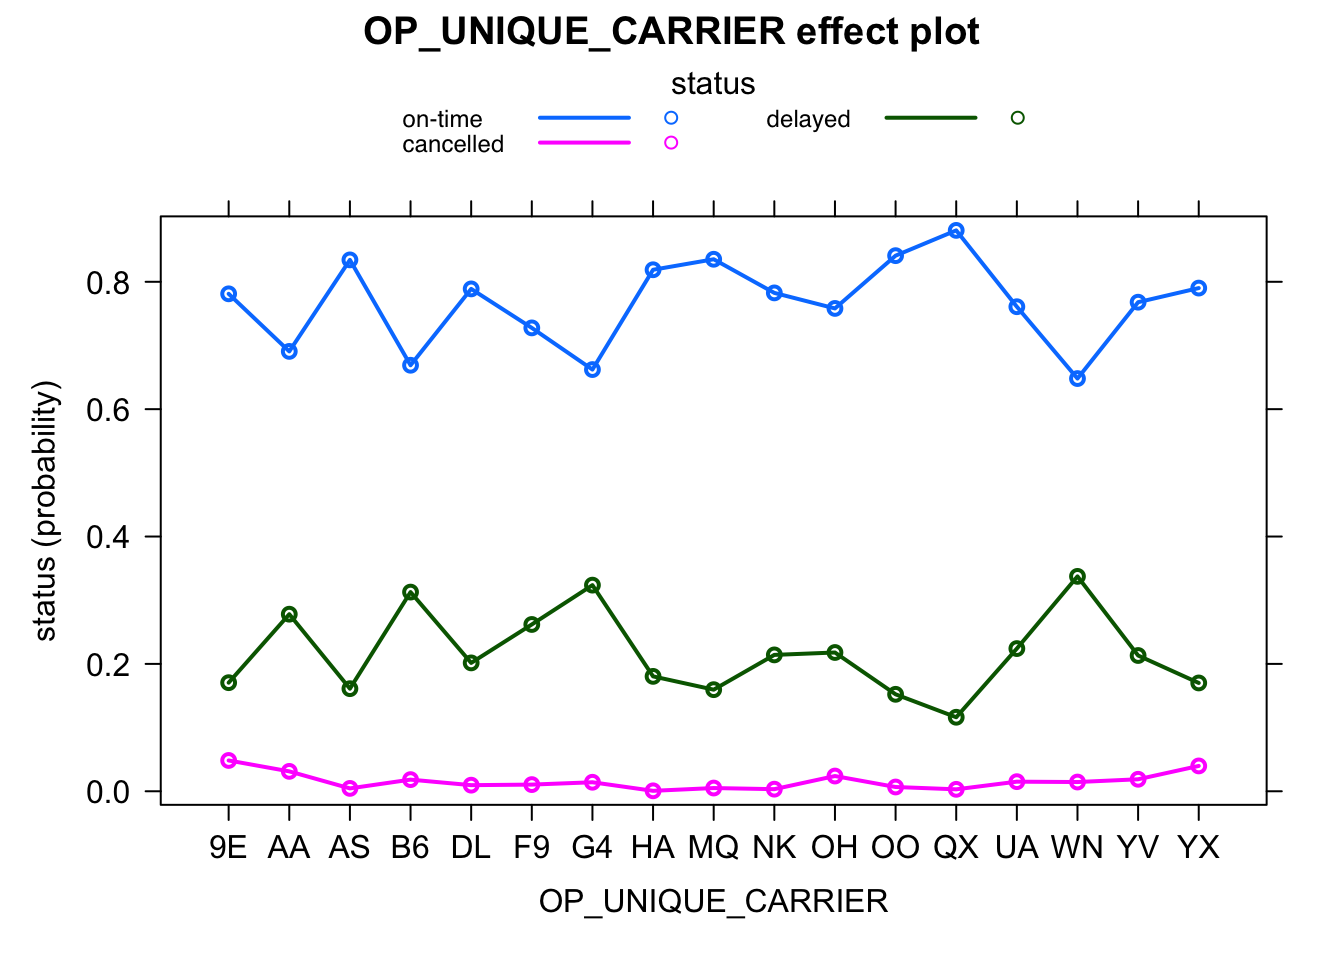
Since the outcome variable “status” contains more than two categories, we predict on-time performance using multinomial logistics model instead of normal logistics model. According to the p-values, most factors have very small p-values (less than 0.01) except for ‘DISTANCE’ and ‘OP_UNIQUE_CARRIERYX’, which is very surprising. This result shows that the coefficient of most factors are significant and their effects could be detected by the multinomial logistics model. We plot the effectiveness of each level within each factor according to air carriers and day of week. Combined visualizations with exponential of coefficients, we notice the following patterns:
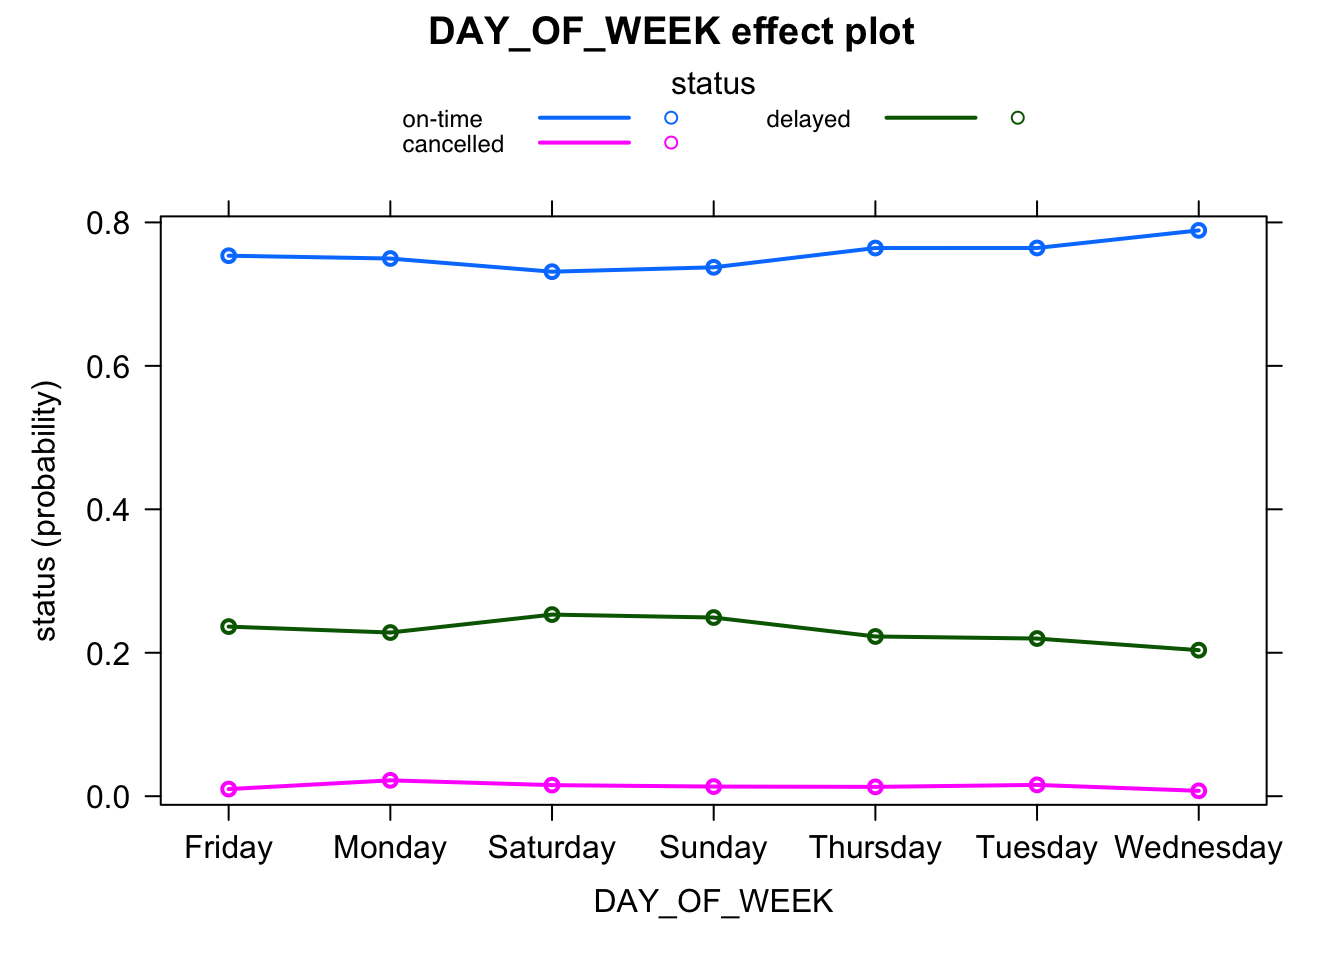
- For delayed flights, the coefficients of Saturday and Sunday are the highest, which might suggest the weekend can be an important factor of delay.
- For cancelled flights, the coefficients of Monday and Saturday are the highest, followed by Sunday, which suggests a different pattern
- Monday might be a more critical factor for cancellation compared with that for delay.
- For delayed flights, the coefficients of carriers hare much larger than the cancelled flights, which implies that carriers might play a more important role when predicting delay.
- For cancelled flights, the coefficients of ‘day of week’ are larger than the delayed flights, which implies that the day of week might play a more important role when predicting delay.
Figure 10. Effect Plots for Carriers and Day of the Week
4.4 Flight Volumn
From this geographical visualization, we observed the airport clusters in Unites States. There are more large airports in the Eastern United States, among which airports in New York, Chicago and Washington are the busiest and connect domestics flight (i.e., Newark International Airport, LaGuardia Airport, Chicago O’Hare International Airport). In the Western United States, airports in Seattle, San Francisco and Los Angeles are busier than others. However, the delay rate from previous heatmap shows that delay in California and most eastern area are not severe, implying that transport system in those regions are more effective and efficient.
Figure 11. Flight Volumn across the U.S.